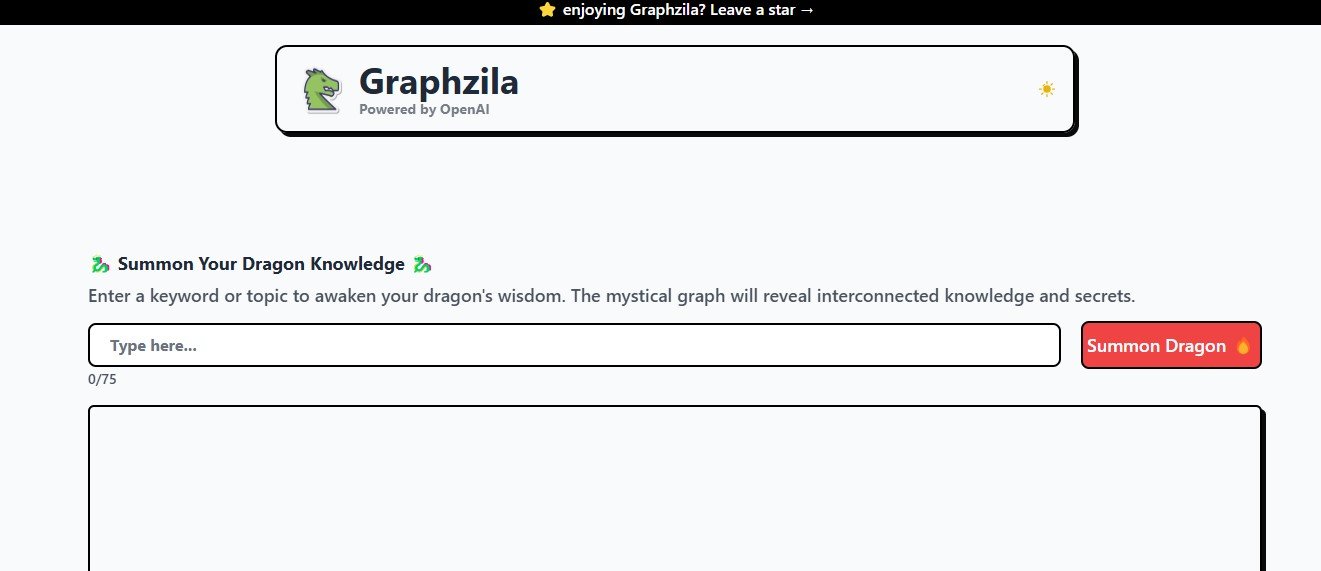
GraphZila is an AI-driven data visualization platform that helps users create stunning, customizable graphs, charts, and dashboards with minimal effort. By using artificial intelligence, GraphZila simplifies the process of turning raw data into visually compelling insights, making it easier to identify trends, track performance, and communicate findings effectively.
Whether you’re visualizing financial data, business KPIs, or research findings, GraphZila adapts to your needs with ease.
Features of GraphZila
GraphZila is packed with features that make data visualization faster, smarter, and more accessible:
- AI-Powered Graph Creation
- Automatically generate graphs and charts from raw data with minimal manual effort.
- Customizable Visualizations
- Choose from a wide variety of graph types, including bar charts, pie charts, scatter plots, line graphs, heatmaps, and more.
- Dynamic Dashboards
- Build interactive dashboards to monitor key metrics and visualize data in real-time.
- Data Integration
- Import data directly from Excel, Google Sheets, databases, APIs, or cloud platforms.
- Collaboration Tools
- Share graphs and dashboards with your team for collaboration or embed them in presentations and websites.
- Drag-and-Drop Editor
- Easily customize graphs with a user-friendly drag-and-drop interface for text, colors, legends, and more.
- Templates Library
- Access pre-designed templates tailored to various industries like finance, marketing, education, and research.
- AI Insights
- Let AI analyze your data and highlight trends, anomalies, or correlations.
- Export Options
- Export graphs and dashboards in multiple formats, including PNG, JPG, PDF, and interactive HTML.
- Mobile and Web Compatibility
- Access GraphZila on any device to create or edit visualizations on the go.
How Does GraphZila Work?
GraphZila is designed to simplify data visualization for everyone, regardless of technical expertise. Here’s how it works:
- Import Your Data
- Upload your data via Excel, Google Sheets, or API integrations directly into GraphZila.
- Choose a Graph Type
- Select from a wide range of graph types, or let the AI recommend the best one based on your data.
- Customize Your Visualization
- Use the drag-and-drop editor to fine-tune your graph’s colors, labels, and layout.
- Add AI Insights
- Enable AI analysis to highlight key trends, patterns, or anomalies in your data.
- Share or Export
- Share your graph with colleagues via a link, embed it on your website, or export it in the desired format for presentations or reports.
Use Cases of GraphZila
GraphZila is versatile and serves various industries and purposes. Here are some common use cases:
- Business Analytics
- Visualize KPIs, sales performance, and financial data to track business growth and identify opportunities.
- Marketing Campaigns
- Create compelling visuals to demonstrate campaign performance, audience engagement, and ROI.
- Academic Research
- Present research findings with detailed graphs and charts to make complex data more comprehensible.
- Project Management
- Use Gantt charts, timelines, and progress trackers to monitor project milestones and deadlines.
- Customer Insights
- Analyze customer behavior, purchasing trends, or survey data to improve products and services.
- Educational Presentations
- Help students and educators explain concepts through data-driven visual aids.
Pricing
GraphZila offers flexible pricing plans to cater to different needs and budgets. Below is a breakdown of the available options (as of January 2025):
- Free Plan
- Limited graph types and templates, with basic export options.
- Best for individuals or small-scale projects.
- Pro Plan: $12/month
- Includes access to all graph types, AI insights, and advanced export formats.
- Ideal for freelancers, marketers, and educators.
- Business Plan: $39/month
- Offers team collaboration features, dynamic dashboards, and priority support.
- Designed for small and medium-sized businesses.
- Enterprise Plan: Custom Pricing
- Tailored for large organizations with dedicated support, custom integrations, and unlimited access to all features.
For the latest pricing details, visit the GraphZila pricing page.
Strengths of GraphZila
- AI Automation: Automatically generates graphs and highlights trends, saving time and effort.
- Customizable Visuals: Offers extensive customization options to match your branding or project needs.
- Easy to Use: Intuitive drag-and-drop tools make it accessible even for non-technical users.
- Real-Time Dashboards: Allows businesses to monitor performance metrics dynamically.
- Affordable Plans: Pricing options make it accessible for individuals, teams, and enterprises.
Drawbacks of GraphZila
- Limited Free Plan: The free plan has restricted features, making it less suitable for advanced projects.
- Learning Curve for Advanced Features: New users may require time to fully leverage AI insights and dashboard functionality.
- Custom Branding in Higher Plans: Advanced branding options are available only in paid tiers.
Comparison with Other Tools
Here’s how GraphZila compares to other data visualization platforms:
- Tableau: Tableau is more advanced and enterprise-focused, while GraphZila provides a simpler, more user-friendly experience for smaller teams and individuals.
- Google Data Studio: Google Data Studio is free and integrates well with Google products, but GraphZila offers more customization and AI-powered insights.
- Canva: Canva is primarily for graphic design, while GraphZila specializes in data visualization and dashboards.
Customer Reviews and Testimonials
Here’s what users are saying about GraphZila:
- Emily R., Data Analyst: “GraphZila’s AI insights make it so much easier to identify trends and present data effectively. It’s a must-have for my work!”
- John T., Marketing Manager: “The templates and customization options are fantastic. I can create professional-looking visuals in minutes.”
- Sophia L., Researcher: “As a researcher, GraphZila has been invaluable for turning complex datasets into clear, understandable graphs.”
Conclusion
GraphZila is a powerful, AI-driven platform that simplifies data visualization for professionals, teams, and businesses. With its intuitive tools, dynamic dashboards, and advanced AI insights, it’s perfect for turning raw data into actionable visuals.
Whether you’re managing a marketing campaign, analyzing business trends, or presenting research findings, GraphZila provides everything you need to create impactful graphs and charts. Its flexible pricing and user-friendly interface make it accessible for beginners and experts alike.
Ready to transform your data into compelling visuals? Visit the official GraphZila website and get started today!